[NIPA AI 교육/기본] 데이터 분석하기(3)
1. 데이터 읽기
- 필요한 패키지 설치 및 import
import numpy as np
imort pandas as pd
import matplotlib.pyplot as plt

# !pip install seaborn==0.9.0
import seaborn as asns

print(sns.__version__)
## missingno 라이브러리가 설치된 경우 import
try:
import missingno as msno
# missingno라는 라이브러리가 설치되어 있지 않을 경우 설치 후 import
except:
!pip install missingno
import missingno as msno
- pandas의 dataframe으로 데이터 읽고, 확인해보기
df = pd.read_csv('data path', encoding='euc-kr')

df.head()    # 상위 5개 데이터 출력
df.head(10)  # 상위 10개 데이터 출력
df.tail()    # 하위 5개 데이터 출력

df.info()    # dataframe 정보 요약 출력
2. 데이터 정제
2.1. 결측치 확인
- missingno.matrix() 함수 이용
sns.set(font='NanumBarunGothic',
	rc={'axes.unicode_minus': False})

msno.matrix(df)
plt.show()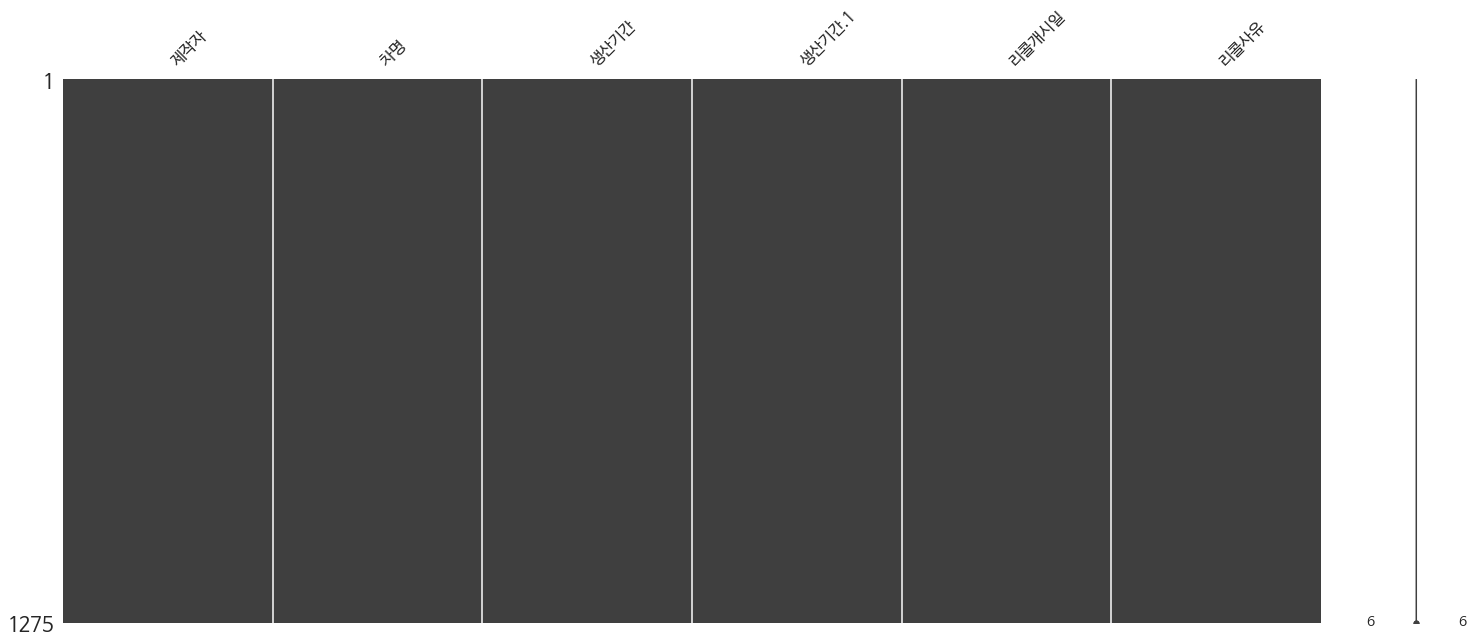
- isna() 함수를 이용해 결측치 확인
- 각 열 별로 결측치의 개수 반환
df.isna().sum() # True: 1, False: 02.2. 중복값 확인
- duplicated() 함수를 이용해 중복값 확인
df[df.duplicated(keep=False)]
- drop_duplicates() 함수로 중복값 제거
# 확인용 print 찍기
print("==> Before:", len(df))

df = df.drop_duplicates()

print("==> After:", len(df))
2.3. 기초 데이터 변형
- 날짜 데이터가 문자열로 인식돼, 정수형으로 바꿔주기
def parse_year(s):
	return int(s[:4])

def parse_month(s):
	return int(s[5:7])
- 분석의 편리를 위해 열 이름을 영어로 바꿈
- pandas의 dataframe에서는 행별로 loop 도는 것이 굉장히 느림 > apply() 함수 이용해 벡터 연산 진행
df['start_year'] = df['생산기간'].apply(parse_year)
df['start_month'] = df['생산기간'].apply(parse_month)
- 불필요한 열은 버리고, 열 이름 재정의
df = df.drop(columns=['생산기간', '생산기간1']).rename(columns={'차명': 'model', '리콜사유': 'cause'})
- 기간 외의 데이터는 삭제
df.recall_year.min(), df.recall_year.max()# 원하는 기간의 데이터만 남기기
df = df[df['recall_year']==2020]
len(df)3. 데이터 시각화
3.1. 제조사별 현황 출력
- 제조사별 리콜 건수 분포를 막대 그래프로 확인
tmp = pd.DataFrame(df.groupby('manufacturer').count()['model'].sort_values(ascending=False))
- 시각화하기
plt.figure(figsize=(20, 10))

# 폰트 변경 -> 한글 출력 위해
sns.set(font='NanumBarunGothic',
	rc={'axes.unicode_minus': False},
    style='darkgrid')

ax = sns.countplot(x='manufacturer', data=df, palette='Set 2', order=tmp.index)
plt.xticks(roration=270)
plt.show()


# index 확인
tmp.index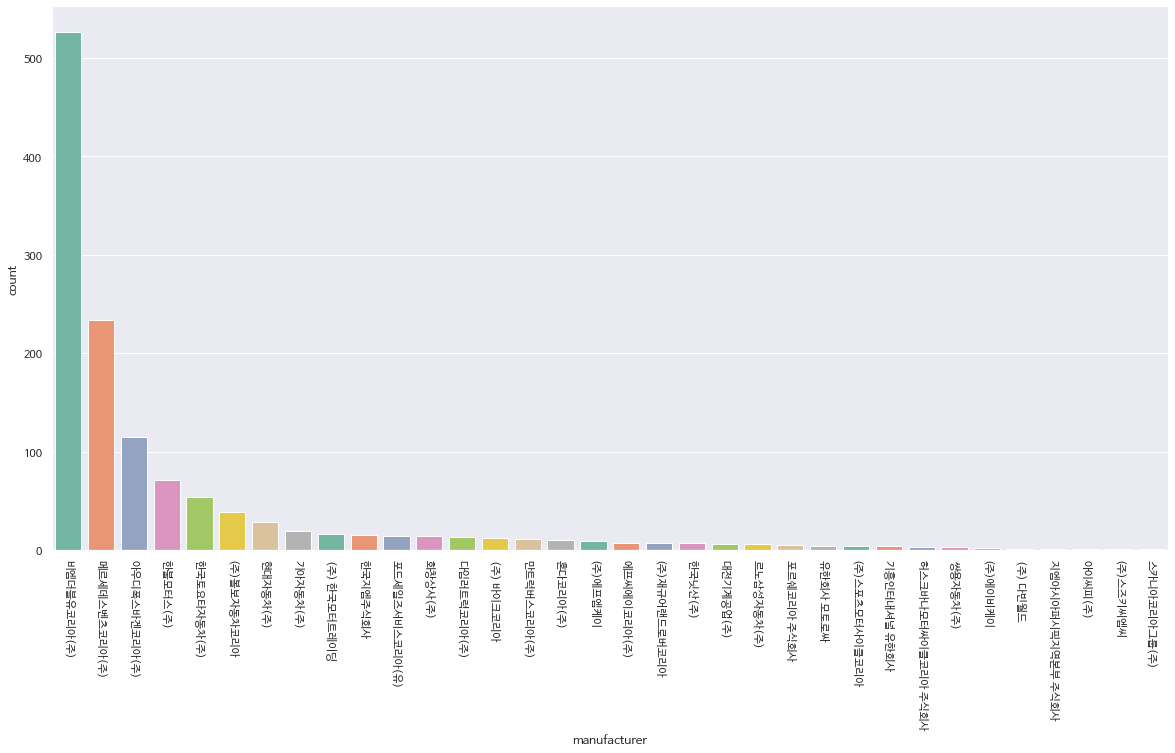
3.2. 모델별 리콜 현황 출력
- 상위 50개만 뽑아서 시각화 진행해보기
tmp = pd.DataFrame(df.groupby('model').count()['manufacturer'].sort_values(ascending=False))

tmp = tmp.rename(columns={'manufacturer': 'count'}).iloc[:50]
- isin : 요소가 Series나 DatFrame의 요소 중 isin() 메서드에 입력된 데이터가 있는지 판별해주는 역할
plt.figure(figsize=(10,5))

sns.set(font="NanumBarunGothic",
        rc={"axes.unicode_minus":False},
        style='darkgrid')
ax = sns.countplot(x="model", data=df[df.model.isin(tmp.index)], palette="Set2", order=tmp.index)
plt.xticks(rotation=270)
plt.show()
3.3. 생산연도별 리콜 현황 출력
- 꺾은선 그래프로 알아보기 : lineplot()
tmp = pd.DataFrame(df.groupby("start_year").count()["model"]).rename(columns={"model": "count"}).reset_index()

plt.figure(figsize=(10,5))

sns.set(style="darkgrid")
sns.lineplot(data=tmp, x="start_year", y="count")
plt.show()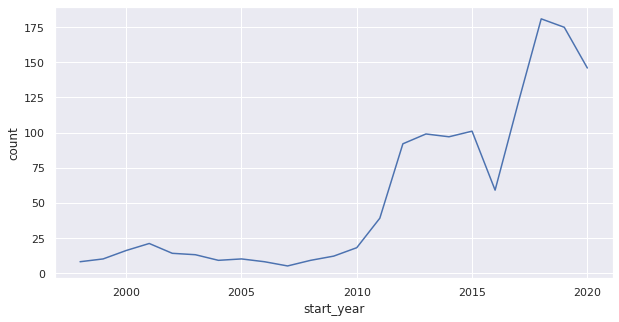
tmp1.iloc[0]['count'] - tmp.iloc[-1]['count']3.4. 4분기 제조사별 리콜 현황 출력
- isin() 이용해 4분기 데이터 출력
df[df.recall_month.isin([10, 11, 12])].head()
- 그래프 출력
plt.figure(figsize=(20,10))
sns.set(font="NanumBarunGothic",
        rc={"axes.unicode_minus":False},
        style='darkgrid')

ax = sns.countplot(x="manufacturer", data=df[df.recall_month.isin([10,11,12])], palette="Set2")
plt.xticks(rotation=270)
plt.show()
3.5. 하반기 생산연도별 리콜 현황 출력
- column 지정해 series 형태로 출력 가능
- 다음의 코드는 7월부터 12월, 즉 하반기의 데이터를 추출하는 코드
df[df.recall_month >= 7].head()
- 시각화하기
plt.figure(figsize=(10,5))
sns.set(style="darkgrid")

ax = sns.countplot(x="start_year", data=df[df.recall_month>=7], palette="Set2")
plt.show()
3.6. 워드 클라우드 이용
- wordcloud 라이브러리 이용
try:
    from wordcloud import WordCloud, STOPWORDS
except:
    !pip install wordcloud
    from wordcloud import WordCloud, STOPWORDS
- STOPWORDS 따로 저장 (문법적인 성분들 배제 위해)
set(STOPWORDS)
- 리콜 사유에 해당하는 열의 값들 중복 제거하기
- 제거 후, 이어 붙여 text라는 문자열로 저장
text = ''

for c in df.cause.drop_duplicates():
	text += c
- 워드 클라우스 생성 후 시각화
- 한글 사용 위해 폰트 지정
wc1 = WordCloud(max_font_size=200, stopwords=spwords, font_path='/usr/share/fonts/truetype/nanum/NanumGothic.ttf',
                background_color='white', width=800, height=800)
wc1.generate(text)

plt.figure(figsize=(10, 8))
plt.imshow(wc1)
plt.tight_layout(pad=0)
plt.axis('off')
plt.show()